
Measure your AI authority and visibility with our prompt tracking tool
We generate between 500 and 600 prompts for a single topic in your business. That's what most tools use to measure your entire company. We measure that same sample every week and tell you whether your authority is going up or down.
Methodology aligned with Bing first-party data · Weekly measurement · ChatGPT, Google AI Mode, Google AI Overview…
Trusted by brands that lead their market
Almost nobody measures AI visibility properly. Neither do we, unless we do it this way
Visibility in AI engines is, today, very difficult to measure properly. Not because the technology is missing, but because what we are measuring behaves differently from a SERP. Anyone promising you a clean, absolute figure is selling you an estimate dressed up as certainty.
These are the four real problems, and what we do about each one.
The samples are tiny
Cross-platform tools measure an entire business with 500 or 1,000 prompts. For a retailer with thousands of categories, that is a needle in a haystack. If your topic is not included in that sample, your topic does not exist in the report.
What we do: we do not measure your business, we measure a topic. And we dedicate the entire sample to it.
Share of voice can be made to say whatever you want
AI share of voice depends entirely on which prompts you choose. Change the list and you change the result. Without a published sample and a clear selection methodology, share of voice is an opinion with decimals.
What we do: a fixed, documented and traceable sample. You can see the prompts your data is calculated from.
The volatility is brutal
Run the same prompt three times and it may cite three different sources. One day Wikipedia, the next a newspaper, another day a Reddit thread. A single AI measurement is almost worthless. Personalization and model variability eat away at the signal.
What we do: we measure weekly and aggregate the data. After a month, you can say things like "for this question, AI almost always cites these three domains", and that is actionable.
First-party data versus third-party data
Only two sources have real data from inside the engine: Bing Webmaster Tools, which covers Copilot and its partners, and Search Console, which in its new AI view only provides impressions, with no clicks or prompts. Everything else in the market, including us as a third party, is modeled and estimated.
What we do: we say so. And we cross-reference our data with the available first-party data instead of competing with it.
The honest conclusion: in AI search, accumulating data is information. A single day's absolute number is not.
Today iRobot leads. The rest of the field is measured. And your brand?
From how people search to the prompts we measure
The quality of the measurement is decided before we measure, by how you choose what to ask. This is the complete pipeline, with no black box.
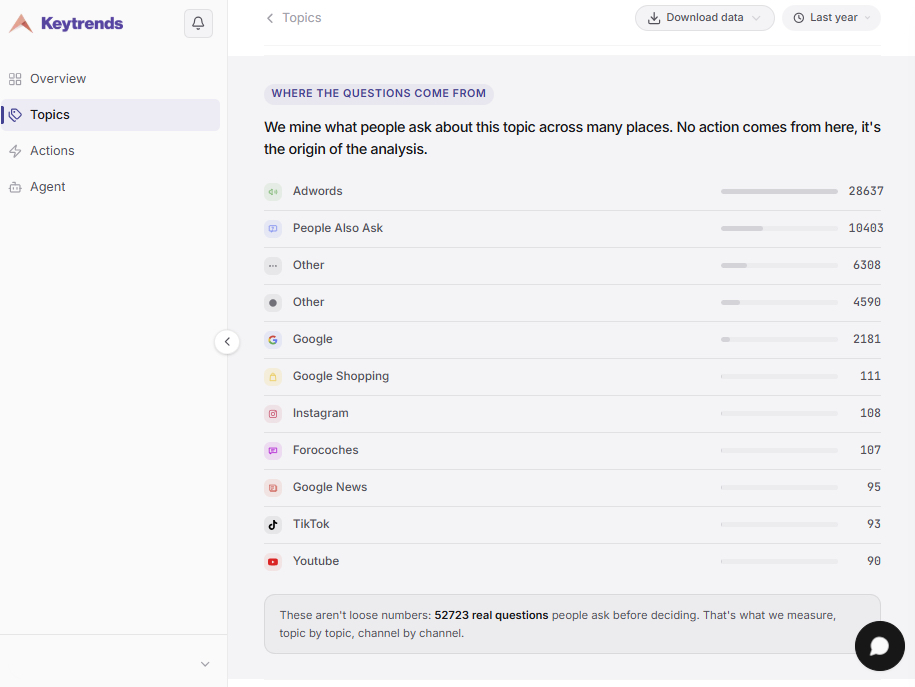
Keyword research across 15 sources
For the topic you choose, we extract real demand from 15 data sources: search and traditional SEO, YouTube, Instagram, Google Trends, Shopping, and the other channels where your customers actually search.
If you only look at Google, you miss how the same need is expressed across the channels where your audience actually asks questions.
Google's PAA as the seed
We use Google's People Also Ask questions and answers as the foundation. Google already has the data on what people ask and, more importantly, how they ask it.
We do not invent the way people ask questions. We take it from the place where it is actually recorded.
Synthetic prompt generation
From that seed, we generate between 500 and 600 prompts per topic, focused on the part of the funnel that matters to you, including transactional intent.
Density. Going vertical is the difference between knowing that "you exist in the sector" and knowing that you are not cited when someone asks about your most valuable category.
Fixed sample
We lock the sample and do not change it. You can add your own prompts, but they are measured in a separate layer.
It is exactly like a keyword ranking. If you add ten new keywords, your average ranking changes even though you have done nothing. If the provider rotates the sample every month, your historical series means nothing.
Weekly measurement
Every week, we run the full sample again, emulating real user behavior as closely as possible.
It is expensive, which is why almost nobody does it at this density. It is what allows us to separate signal from noise.
Aggregation
We aggregate the results to identify stable patterns: who appears, how often, and which sources are cited repeatedly. We also measure how you are cited (sentiment) and which fragments (chunks) of your pages the AI extracts.
The aggregated pattern is the only thing robust enough to support a budget decision.
Our measurement is a modeled approximation, not a census. User personalization makes absolute data impossible. What is solid, and what you should demand from any provider, is that the sample is large, representative, fixed, and auditable.
Five metrics, and what each one doesn't tell you
Each KPI on this list comes with three things: what it measures, what decision it allows you to make, and its limitation. The third point is the one you almost never get.
Authority Score
⌄
What it measures: your aggregated authority within the topic, processed against the previous week.
What you decide with it: whether the overall set of actions from the last cycle is working.
Its limitation: it is a proprietary composite index. It is useful for tracking progress and comparing relative positions within the same topic. It is not a universal score and cannot be compared across different topics.
Position
⌄
What it measures: where you rank in the topic's authority ranking compared with the other domains detected.
What you decide with it: whether your realistic goal this quarter is to enter the top 5 or defend first place.
Its limitation: the ranking includes anyone who appears in the topic, not just your industry competitors.
Share of Voice
⌄
What it measures: the percentage of your brand's appearances across the total topic sample.
What you decide with it: how much of the conversation you actually occupy compared with whoever is taking that space from you.
Its limitation: it depends entirely on the sample. A share of voice without a published sample cannot be compared with another tool's. Never compare our number with another provider's: compare the evolution within the same system.
AI Citations
⌄
What it measures: the number of times your domain appears as a cited source in the responses.
What you decide with it: whether your content is serving as reference material or merely being mentioned in passing.
Its limitation: a citation is not a visit. In AI search, clicks are becoming increasingly scarce, and that is precisely why citations are becoming the KPI that matters.
Share of Authority
⌄
What it measures: your authority weight compared with all the players in the topic, combining presence and citations.
What you decide with it: this is the indicator you take to the leadership team. It answers the question: "Are we the reference in this topic or not?"
Its limitation: it is a constructed metric, not a physical measurement. Its value lies in the time series.
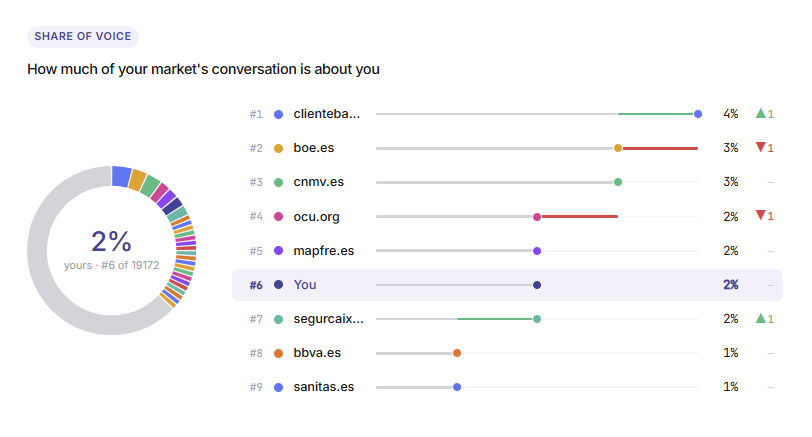
The three indicators we look at first in every client review are share of voice, citations, and share of authority. The overall score is useful for the executive summary; these three are what drive decisions.
When Bing published its AI data dashboard: the metrics it released were search intent, citations, and share of authority. We had been developing exactly that for months. It is no coincidence: it is the result of having previously chosen to stop measuring clicks in an environment where clicks are increasingly scarce.
Who occupies your topic, and who does AI cite to answer
Competitor ranking by topic
For each topic, you see the full list of domains that appear, along with their score, position, and weekly evolution.
The honest caveat: this list is not filtered by industry. If someone has a video talking about your category, they appear. A YouTube creator may rank ahead of a direct competitor. That is the reality of the data, and we would rather show it to you raw than dress it up. You can filter by player type for your analysis, but the starting point is the complete dataset.
How you compare with each competitor, side by side
| Brand | Search | AI | Social | Authority |
|---|---|---|---|---|
|
1
i
iRobot
|
71 ▲3 | 53 ▲7 | 18 ▲4 | 47 ▲4 |
|
2
R
Roborock
|
34 ▲6 | 38 ▲8 | 23 ▲2 | 32 ▲6 |
|
3
Y
You
|
38 ▲8 | 22 ▲6 | 17 ▼2 | 26 ▲4 |
|
4
D
Dyson
|
36 ▼10 | 19 ▲2 | 21 ▲3 | 25 ▼2 |
SERP view and AI view, kept separate
They're not the same picture, and mixing them is misleading. There are domains with huge SERP visibility, comparison sites and aggregators for example, that barely get cited in AI answers. And the reverse happens too. We give you both views separately so you can see where you're losing each game.
Cited sources
For each prompt, we record which domains and URLs the AI cites. Aggregated over time, this becomes a map of who is building your category: which media outlets, forums, comparison sites, channels, and institutional pages.
By far, this is the most actionable data in the system. And it is the point where measurement stops being a report and starts becoming a strategy. See how we turn this into action →
Influencers and mentions
Relevance scoring by mention, topic, and platform across YouTube, Instagram, and TikTok, for topics where the conversation happens outside the web. It is the third data source, alongside search and AI search.
Your own layer, on top of the fixed sample
The fixed sample is designed to measure your authority within the topic using a consistent methodology. But there are always questions that matter specifically to you: how AI compares you with a particular competitor, what it says about a newly launched product, or how it responds to a question that comes up frequently with your customer service team.
Those are your brand prompts. You add them, they are measured in parallel, and they are reported separately, without contaminating the topic's historical series.
Your modeled data, alongside the real data that actually exists
Our measurement is third-party, and we have already explained what that means. The only reliable internal data currently available is:
- Bing Webmaster Tools: citations and impressions across the Copilot and partner ecosystem. Real data, although from an ecosystem that is not the market leader.
- Search Console: the new AI view provides impressions. No clicks, prompts, or citations.
The goal is to have everything in the same dashboard: Keytrends authority, Bing citations, and Search Console impressions, so you can see whether all three are moving in the same direction.
Compare us by sampling methodology, not by feature list
The large suites have more modules than we do, and they will continue to do so. The meaningful comparison is how the data is built, because that is the difference between a number that can support a decision and one that cannot.
| Keytrends | Cross-platform AI search tools | SEO suites with AI modules | First-party data | |
|---|---|---|---|---|
| Unit of analysis | One topic | The entire business | The entire domain | Their own engine |
| Prompts per topic | 500-600 | Dozens | Dozens | Not applicable |
| Prompt source | Google PAA + 15 demand sources | Proprietary generation or purchased prompts | Adapted keywords | Real, unpublished prompts |
| Fixed sample over time | Yes | Variable | Variable | Not applicable |
| Frequency | Weekly | Variable | Variable | Continuous |
| Sources cited per prompt | Yes, aggregated | Partial | Partial | Partial (Bing) |
| Nature of the data | Modeled, disclosed | Modeled | Modeled | Real |
| Engine coverage | Multi-engine | Multi-engine | Multi-engine | Own engine only |
Competitor names and each individual cell are pending verification before publication.
If another tool gives you a higher share of voice than ours, ask how many prompts it calculates it from. That is usually where the whole explanation lies.
Nine weeks of a real topic
customer service
How you're leading this conversation today, across search, AI and social.
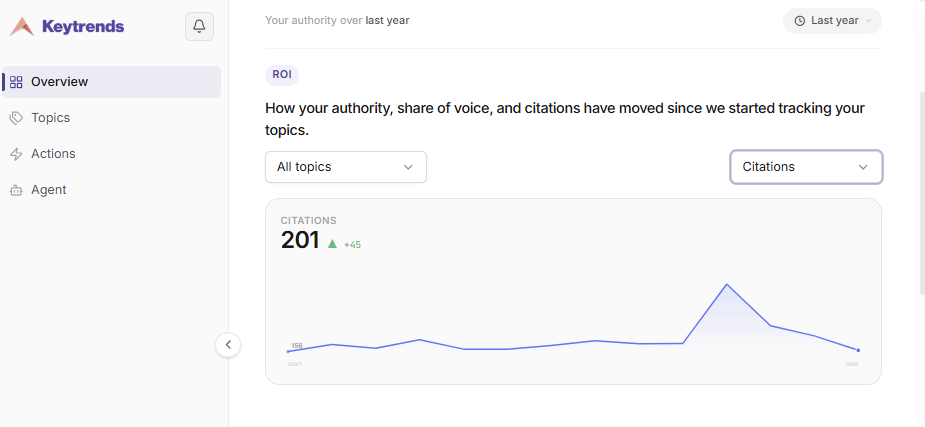
How your score and AI citations have evolved since we started measuring this topic.
The orange dots mark the weeks when plan actions were executed. You've been measuring this topic for 92 days.
What we want you to see here isn't a percentage of improvement. It's that the series exists, that it's continuous and that it's comparable. That's what almost nobody can show you today.
Testimonials

“Keytrends fills a very important gap in the SEO sector: real-time tracking of search trends. Thanks to Keytrends we have been able to automate the detection of organic opportunities and be much more agile when it comes to covering them.”
“KeyTrends allows you to monitor the real-time evolution of search trends to optimise your content in just a few minutes.”
“Word of mouth has always been our main source of sales, but with Keytrends we have managed to grow in organic traffic, obtain new leads and position ourselves as a reference.”
Frequently asked questions
Can you really measure visibility in ChatGPT?
Not with absolute accuracy, and be wary of anyone who tells you otherwise. ChatGPT does not publish prompts or citations, and its responses are highly personalized. What we can do, and what we do, is build a representative and stable sample of real questions, measure it regularly, and track the trend. That is enough to decide where to invest. A single day's absolute number is not.
Why do you measure weekly rather than daily?
Because AI volatility means that a single measurement provides little value, and measuring 500-600 prompts at this density comes at a high cost. Weekly is the point where the data is stable enough while the cost still makes sense. If you need a different aggregation, biweekly or monthly, it can be configured.
What happens if I change topics or add prompts?
A new topic starts its own series from the day it is added. Any additional prompts you want to track are measured as brand prompts, in a separate layer, so they do not break the comparability of the fixed sample. It follows the same logic as a keyword ranking: if you change the list, you change the average without anything real having changed.
How many prompts do you measure, and why so many?
Between 500 and 600 per topic. That is roughly what other tools dedicate to an entire business. The density is what allows us to identify the specific questions where you do not appear, instead of leaving you with an average that does not tell you where to act.
What is the difference between share of voice and share of authority?
Share of voice measures how often you appear across the total sample. Share of authority combines that presence with your citations as a source and the relative weight of the other players. The first tells you how visible you are; the second tells you how much you are treated as a reference. You need both.
Why don't you provide clicks or traffic from AI?
Because that data does not currently exist in a reliable form. Search Console only provides impressions in its AI view, and no other platform publishes clicks or prompts. Any tool that gives you attributed traffic from AI is estimating. To measure impact on your website, we use another approach: tracking the URLs you work on and monitoring how they evolve.
How do I know that your prompts represent my business?
Because you can see them. The sample for each topic is available for review, and if a block of questions does not reflect your reality, it is adjusted before the sample is finalized. You can also add your own prompts as an additional layer.
Does this replace my SEO tool?
No. It is a different layer. Your SEO suite tells you how you perform in the SERP; this tells you how you perform in generative answers and who is being cited instead of you. We provide both views separately precisely because they do not coincide.
What happens after you measure?
That is where the other half of the work begins. Every gap identified and every source cited is turned into prioritized actions. If you would rather we execute them, platform + consultancy starts from 700 € per topic. See how we turn this into action →
You already know how to measure it. The question is what you do on Monday
A dashboard doesn't move the needle. What moves it is knowing what content to create, what to optimize, and which outlets you need to show up in for AI to cite you. That's the second half of the system, and you can run it yourselves with the platform or with us on platform + consultancy, from 700 € per topic.
Pick a day and time in our calendar. Opens in a new tab.