Keytrends AI Content Marketing suite v2.15
Tabla de Contenidos
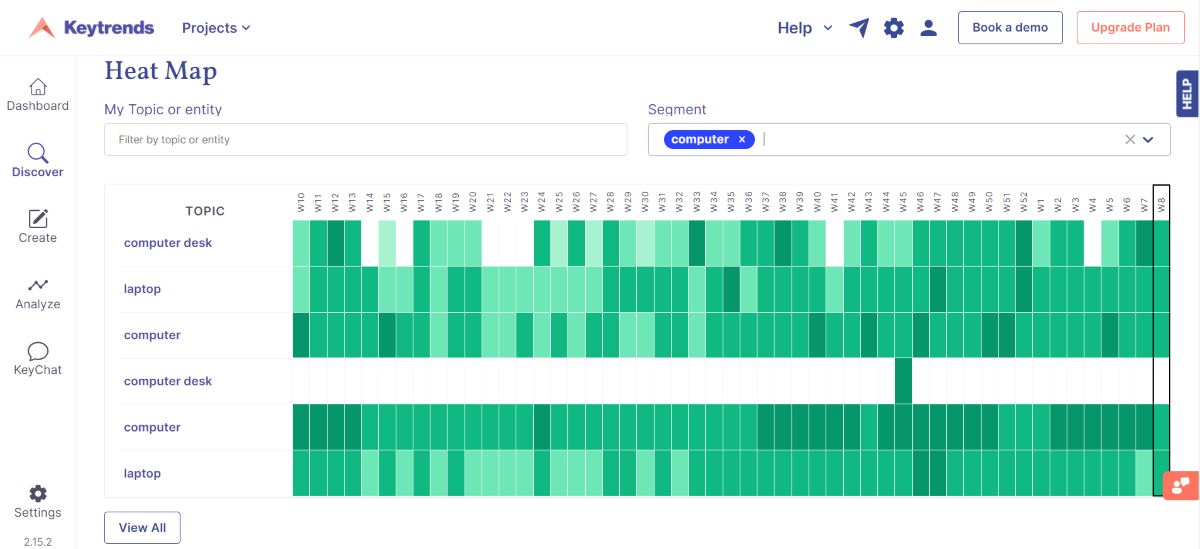
This version of the platform is coming hot…. Because the heat map for the project topics, which we also call the annual seasonality calendar, is now available.
And that’s exactly what you will see: the evolution of the demand for each topic and at what times of the year it reaches the highest levels of volume and trend. We show you in detail:
Annual calendar of trends and seasonality (Heat map)🔥
When you have hundreds of topics to work on, prioritising which ones to cover and when to cover them is a must if you want to meet your business objectives. Creating for the sake of creating does not work because users do not demand the same products or the same information throughout the year.
And this is what your competition does not work on: the seasonality of each topic and the prioritisation of content. This, added to the fact that search engines like Google reward fresh content (do you know their Freshness algorithm?), can boost your visibility if you publish at the right time (and with the right type of content).
This is the new Topics annual calendar:

What information do you have in this calendar and how can you make use of it?
- Trend data for each week of the year, and cumulative volume data for that month. The higher the growth of the theme in a given week, the more intense we will paint it.
- Quick annual growth graph: next to each topic you will have at hand the graph that summarises the annual evolution of the topic, which is a reflection of the data that you will find week by week. Use it to quickly identify the topics that are in the doldrums and those that, on the contrary, show peaks of interest. You know which one to prioritise 😉
- Filters by topic or by segment (tags): if you manage hundreds or thousands of topics, you can filter them and see only those that have to do with a specific segment. Or, if you want to see a specific topic, you can also search for it.
Trend or volume: which to choose
You may come across a topic that has a very high trending level, but a low search volume. Remember what we mean when we talk about these two pieces of information:
- Trend: occasional but very, very pronounced growth peaks that occur at certain times of the year. It happens in seasonal themes or in themes that are determined by specific events or happenings. These topics can be planned for a year ahead, but when the moments of greatest demand arrive, you have to be aware of the queries that arise in real time in order to cover them.
- Volume: the accumulated number of user searches in the organic channel, which includes hundreds of queries that can be more generic or more long tail. These should be used for your timeless or evergreen content strategies.
As you can see, you can work on both types of content strategies; plan for the long term, or see what topic is in demand at that very moment and detect real time queries.
By the way: you have this other simplified view in your Topics Opportunities section, where you can guide yourself by the heat map and see the demand week by week with the 52 weeks of the year to see it all at a quick glance ↓

The important thing about all this is that you will not go blindly and that you will be able to create content demanded by your users and profitable for your business in every season 📅
A very useful feature for your content strategy and calendarisation, right?
These are the highlights of our v2.15, but you can read about minor improvements and bug fixes in the general release notes.
Ask us any questions you might have in the comments, send us an email or book a 30 minute demo so we can show you all the new features 👇
